Hi AJ,
Question:
I need to create a variance formula for the data selected in a pivot table.
My problem is that the data is coming in from one column and I don't know how
to distinquish the data by year in the formula. I have put a small selection
of my data below. I would like to show the variance between 2009 and 2010
for all months selected in the pivot table.
Answer:
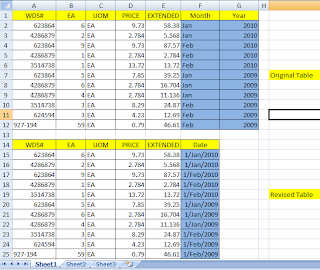
Base on the question and data, I summary it in the Original Table below (Picture 1). In order to show the variance between 2009 and 2010, I believe the better way is summary the Month and Year column into Date column as Revised Table below. With the Date column, you can manipulate the data into many way as you like as explanation below.
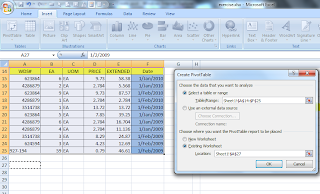
After you revised the table to Date column, you can select the table and click Insert, PivotTable. Select the appropriate option as Picture 2.
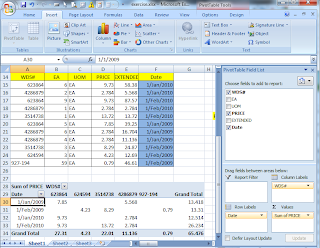
Simply drag the required fields to Columns Label, Row Labels, Values, or Report Filter at PivotTable Field list. The PivotTable will then created.
Now you can manipulate the PivotTable as you like. You can group the date by year. Click at the date field, right-click and select Group.
The Grouping message box will show. Make the selection. In this case, I want to group by Year, so select Years. Then click OK.
Now you can see the different of year 2009 and 2010. Hopefully it can solve your question. If not, do not hesitate to write your question at comment. Thank you.


No comments:
Post a Comment
Note: Only a member of this blog may post a comment.